$29,90Original price was: $29,90.$19,90Current price is: $19,90.
Sale!
Lynzaa-Complete-Financial-Management-System
$29,90Original price was: $29,90.$19,90Current price is: $19,90.
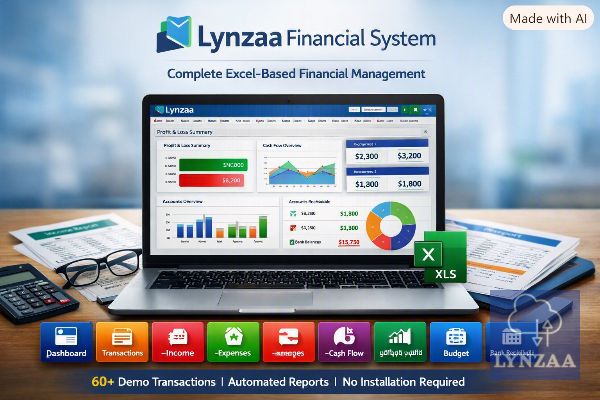
Lynzaa is a complete Excel-based financial management system featuring 12 integrated modules — Dashboard, Transactions, Income, Expenses, A/R, A/P, Cash Flow, Budget, and Bank Reconciliation. Pre-loaded with 60+ demo transactions, automated formulas, and professional reporting for small-to-medium businesses. No software installation required.
Lynzaa — Complete Financial Management System is a powerful, all-in-one Excel-based solution designed to help small and medium businesses take full control of their finances without the complexity or cost of traditional accounting software.
Built around 12 tightly integrated modules, Lynzaa covers every critical aspect of business financial management:
Dashboard — A real-time executive overview displaying key performance indicators including Total Income ($143,776), Total Expenses ($46,276), Net Profit ($97,500), Cash Balance, A/R Outstanding ($27,310), A/P Outstanding ($13,078), and Profit Margin (67.8%). Visual analytics include monthly income vs. expense charts, expense breakdown by category, cash flow trends, and budget vs. actual comparisons.
Lists — Centralized master data management for Income Categories (Sales, Services, Consulting, Affiliate Income, Advertising, Other Income), Expense Categories (12 categories from Advertising to Professional Services), Payment Methods (Cash, Bank Transfer, Credit Card, Debit Card, Check, Other), Statuses, Customers (10 clients), and Vendors (10 suppliers).
Setup — Business configuration hub containing company details (Lynzaa Demo Inc.), financial settings (USD currency, fiscal year starting 2026-01-01), starting balances ($25,000 cash / $45,000 bank), and default preferences.
Transactions — The core data entry sheet with 60 pre-loaded transactions spanning January through August 2026. Each record includes Transaction ID, Date, Type (Income/Expense), Category, Description, Customer/Vendor, Payment Method, Account, Amount, Tax (10%), Total, Status, and Reference.
Income & Expenses — Dedicated tracking sheets with 25 detailed records each, showing invoice numbers, due dates, payment status (Paid, Due, Partially Paid), and outstanding balances.
Accounts Receivable & Payable — Aging reports that categorize outstanding balances by time periods (Current, 1-30 Days, 31-60 Days, 61-90 Days, 90+ Days), helping prioritize collection and payment efforts.
Cash Flow — Monthly cash flow statement tracking Opening Cash, Inflows, Outflows, Net Cash Flow, and Closing Cash — showing growth from $25,000 to $95,190 YTD.
Budget — Annual budget vs. actual comparison across 12 expense categories with monthly allocations, total actuals, variance calculations, and variance percentages.
Bank Reconciliation — Side-by-side comparison of bank statement amounts vs. book amounts with reconciliation status, difference tracking, and unreconciled item flags.
Reports — Automated financial reports including Income Statement, Monthly Income Report, Expense Report by Category, Cash Flow Summary, A/R Aging, A/P Aging, Budget vs. Actual, and Annual Financial Summary.
Key Benefits: No installation required, works in Excel and Google Sheets, fully customizable categories and lists, automated calculations and summaries, professional-grade reporting, and a complete demo dataset that can be cleared and replaced with real business data.
Perfect for: Freelancers, small business owners, startups, and finance teams who need a structured, visual, and affordable alternative to expensive accounting platforms.